
What’s an Enterprise data platform? And why your company needs one?
Enterprise data platforms are becoming critical infrastructure for business competitiveness. To unlock value from them you need to understand them as layers

An enterprise data platform (EDP) is a collection of tools and technologies that allow organisations to make data driven decisions, experiences and products. It is a valuable asset to all organizations that reach a critical size and if leveraged correctly it can drive growth, revenue and margins.
According to this McKinsey article, high-performing data organizations are three times more likely to say their data and analytics initiatives have contributed at least 20 percent to EBIT. More recently, in this Snowflake Research, organizations that are early GenAI adopters see a 41% ROI. However organizations still struggle with time-consuming data management (55%), quality issues (52%) and data sensitivity concerns (50%). And that’s where a good EDP shines.
In this article we will explore the key components of an EDP and how they interface with each other to drive the end goal of unlocking value from business data. let’s start!
How to think about modern EDPs
Modern enterprise data platforms are cloud native, scalable, and governed holistically. They are best thought of as a stack of technologies where each technology is a layer that serves a specific purpose. We can see how these layers interact in the figure below.
Data flows from its sources through these layers. In order to be useful for business users, Data is transformed, joined, cleaned, enriched and stored as official, trustworthy data products. These data products serve as the basis for generating and serving analytics in the insights layer which is where “ busines decisions happen” and data is leveraged by end users to drive both daily operations and strategic decisions.
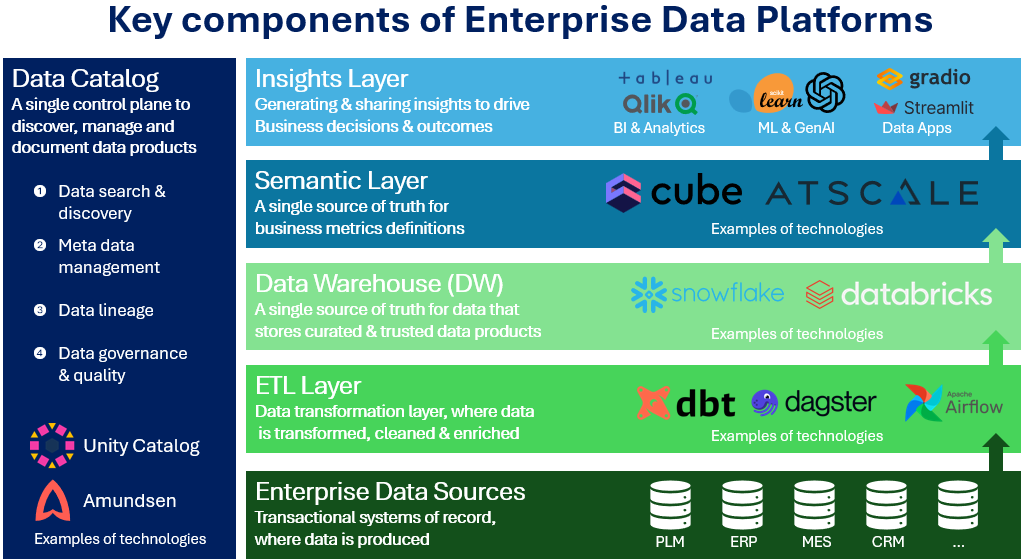
The Key building blocks of modern enterprise data platforms (EDPs) are:
1. The ETL layer
2. The Data warehouse layer
3. The Semantic layer
4. The Insights layer
5. The Data catalog
To understand how these technologies are orchestrated together to get value from data let’s dive into the role of each component. To do so we need to start outside of the EDP, with the enterprise data sources.
Data sources or systems of record: where your business runs
Business operations run on transactional systems. These are the systems of record where business data is created in the first place. These systems are the backbone of daily business operations and the ultimate source of truth because they are where the source data is created.
If we take the example of a manufacturing company the enterprise Data sources are the PLM where the product configuration is stored, the ERP system where manufacturing operations are planned, the CRM system where customer relations are managed and so on…
These are the mission-critical transactional systems that run business operations. They are not suited for analytical jobs for three main reasons:
Analytics queries can jam or slow down these mission critical systems which can hinder business operations.
The raw data format in these systems is not analyst or business friendly and can be difficult to understand.
The databases of these systems are often row based engines rather than columnar, which is not optimal for the speed of analytics queries that often require column based level aggregations
The smart thing to do then is to ingest the data from these source systems to the EDP. And that is the role of the ETL layer
ETL layer: Extract and transform your data
This layer is a critical component of any EDP. Key data transformations are applied, for example joining data from different ERP sources to a unified table with harmonized identifiers or cleaning columns with erroneous values or enriching tables with calculated columns that are useful for downstream applications. the ETL layer is a bridge from your source systems to your Data warehouse
Data warehouse layer: Store and query your data in a safe and scalable environment
This is the place where your analytical datasets live. It provides a single source of truth with curated, ready to use datasets. Modern data warehouses like Snowflake or Databricks are cloud native and have scalable compute and storage that can adjust to the analytical workloads and the size of your data. The data warehouse is specifically suited for analytics because it is optimized for columnar operations. Also, it presents data to the users that is as close as possible to business terms when it comes to its content and schema. That makes the data more usable for analysts and business teams.
Semantic layer: Define your business metrics over your data in a centralized source of truth
This is a relatively new addition to the modern EDP, however if implemented correctly it can significantly boost the quality and consistency of the insights generated in the insights layer. A semantic layer is also called a metrics store which is a much clearer description of what it does. In essence, a semantic layer is a single source of truth where you define your business metrics, for example, how revenue is defined and calculated or what is the business rule for calculating on time deliveries or what is the business definition of inventory levels or of missing parts ratios, etc.. This layer is then used as a unified input to different insights engines like BI tools, data analysis tools or Machine learning pipelines. A well-built semantic layer helps businesses avoid the awkward situation of having two dashboards showing two different values for revenue or two different inventory levels because they used inconsistent KPI definitions (i.e. metrics). This kind of KPI definition mismatch is more prevalent than you think and can erode trust in data and insights quickly because what’s worse than no data is wrong, inconsistent data.
Insights layer: Build and share trusted insights
This is the destination of your data and where most of your users will interact with it.
There are obviously different tools to generate and distribute analytical insights, but we can broadly cluster them into three types:
Descriptive: BI dashboards, and analytics tools. These are the tools that help you visualize, filter and drill down your data to answer your business questions. They are descriptive in nature.
Predictive: AI and GenAI models that help you predict and generate new information from your already existing data for example you can use your factory production datasets like work orders to build demand forecasting curves to share with your suppliers or you can build your logistics warehouse outbound data to build a forecast of future missing parts.
Data Apps: These are tools that let you build customized user interactions with data including serving of descriptive and predictive analytics, combined with user specified inputs, custom layouts and more advanced personalization.
To put our own work on AI native analytics in perspective here: our platform ChatSQL fits within the insights layer and it’s a tool that combines predictive and generative analytics: It leverages the schema of your data, your natural language queries and our GenAI engine to generate accurate SQL code (that’s the predictive part), executes it on your data warehouse and generates tabular and visual insights on demand (that’s the descriptive part)
Data catalog: the glue that holds everything together
Data catalogs are the glue that holds all these layers together. They come in open-source flavors like Amundsen and Unity Catalog or paid platforms like Alan or Collibra. Data catalogs provide key functionalities that are critical for large scale data analytics efforts. These functionalities are:
Data search and discovery: For most analysts and business users who have a data question, searching for the right dataset to answer that question is often the first hurdle people face. A good data catalog should make that search easier and help surface trusted data products that fit the users’ analytical needs
Metadata storage management: documentation of the datasets schema, natural languages descriptions of tables and columns, value stats, are all extremely helpful information for analysts and business users to understand the data and interpret it in the right way. Modern data catalog streamline the creation and management of this metadata
Data governance: your EDP is a marketplace where you have data consumers (data analysts and business users) and data providers (data engineers, data officers and data stewards). Obviously certain datasets should be accessible company-wide, others are access-restricted to given teams or personas, for example the finance team, the procurement team or the top management. A good data catalog should provide your organization with granular, auditable and flexible access controls facilitating data governance
Data lineage: Data catalogs often offer visual representation of the calculations and transformations used to generate a given dataset from its sources. This visualization graph is useful for analysts trying to understand where the data came from and whether it can be trusted to generate insights
To wrap up: EDPs are a critical infrastructure for a competitive enterprise
EDPs are best thought of as layers of technologies with specific roles. Data flow through each layer in order to be used bu end users i.e. business teams to make data driven decisions and improve the business. Investing in your EDP infrastructure and your data teams will empower your business teams with:
Available, usable, discoverable good quality datasets that can be consumed with ease
Trusted, fast and shareable insights that drive actual business decisions, reduce friction and translate into actual EBIT growth
Building the right EDPs by composing the right tools at each layer will enable you to achieve that goal faster.
Curious about AI native analytics, EDPs or data topics in general? contact us on LinkedIn or book a demo with us